MCMC Post-hoc Analysis: 68 sequences
Data & Model
| Partition | Sequences | Lengths | Alphabet | Substitution Model | Indel Model | Scale Model |
|---|
| 1 |
ITS1-trimmed.fasta |
198 - 210 |
DNA | S1 = tn93+Rates.free[,,3] |
I1 = rs07 |
scale1 ~ gamma[0.5,2,0.0] |
| 2 |
5.8S.fasta |
15 - 16 |
DNA | S2 = tn93 |
none |
scale2 ~ gamma[0.5,2,0.0] |
| 3 |
ITS2-trimmed.fasta |
154 - 159 |
DNA | S1 = tn93+Rates.free[,,3] |
I2 = rs07 |
scale1 ~ gamma[0.5,2,0.0] |
Scalar variables
| Statistic | Median | 95% BCI | ACT | ESS | burnin | PSRF-CI80% | PSRF-RCF |
|---|
| prior |
-92.02 |
(-144.6, -41.7) |
15.15 |
62439 |
202
|
0.9999 | 1.001
|
| prior_A1 |
-404.6 |
(-434.9, -379) |
6.26 |
151133 |
305
|
1 | 1.005
|
| prior_A3 |
-198.9 |
(-223.2, -180.5) |
29.83 |
31714 |
243
|
1 | 0.999
|
| likelihood |
-2967 |
(-2998, -2936) |
20.55 |
46048 |
458
|
1 | 1.002
|
| posterior |
-3059 |
(-3106, -3014) |
6.103 |
155018 |
175
|
0.9998 | 1.002
|
| Heat.beta |
1 |
| | | | | |
| Scale[1] |
1.12 |
(0.8317, 1.467) |
1.254 |
754205 |
208
|
0.9999 | 0.9981
|
| Scale[2] |
0.07923 |
(0.03648, 0.1333) |
1 |
946098 |
88
|
1 | 0.9996
|
| S1/tn93:pi[A] |
0.1846 |
(0.1552, 0.2146) |
3.541 |
267217 |
324
|
0.9997 | 1.002
|
| S1/tn93:pi[C] |
0.313 |
(0.2775, 0.3489) |
3.384 |
279614 |
216
|
1 | 0.9991
|
| S1/tn93:pi[G] |
0.2712 |
(0.237, 0.3073) |
4.05 |
233607 |
202
|
1 | 0.9975
|
| S1/tn93:pi[T] |
0.2302 |
(0.1992, 0.2623) |
3.545 |
266858 |
277
|
1 | 0.9976
|
| S1/tn93:kappaPyr |
3.985 |
(3.073, 4.998) |
2.258 |
419085 |
132
|
1 | 0.9992
|
| S1/tn93:kappaPur |
2.703 |
(2.008, 3.506) |
1.755 |
539192 |
107
|
1 | 0.9999
|
| S1/Rates.free:frequencies[1] |
0.4485 |
(0.1773, 0.658) |
9.835 |
96193 |
299
|
1 | 1.001
|
| S1/Rates.free:frequencies[2] |
0.2686 |
(0.06417, 0.4905) |
4.897 |
193214 |
265
|
1 | 0.9998
|
| S1/Rates.free:frequencies[3] |
0.3008 |
(0.08767, 0.4654) |
8.672 |
109092 |
462
|
1 | 1
|
| S1/Rates.free:rates[1] |
0.05259 |
(0.01176, 0.1016) |
7.26 |
130317 |
395
|
1.001 | 0.9994
|
| S1/Rates.free:rates[2] |
0.2368 |
(0.08345, 0.4381) |
12.4 |
76292 |
400
|
0.9998 | 1.004
|
| S1/Rates.free:rates[3] |
0.7145 |
(0.503, 0.8532) |
11.57 |
81745 |
493
|
0.9998 | 1.005
|
| S2/tn93:pi[A] |
0.2448 |
(0.1833, 0.3111) |
2.699 |
350589 |
208
|
0.9999 | 1.002
|
| S2/tn93:pi[C] |
0.2408 |
(0.179, 0.3058) |
2.74 |
345240 |
326
|
1 | 0.9969
|
| S2/tn93:pi[G] |
0.245 |
(0.1825, 0.3105) |
2.713 |
348691 |
249
|
0.9999 | 1.002
|
| S2/tn93:pi[T] |
0.2655 |
(0.2012, 0.3324) |
2.718 |
348083 |
203
|
0.9998 | 1.002
|
| S2/tn93:kappaPyr |
2.762 |
(1.646, 4.185) |
1.048 |
902444 |
121
|
1 | 1
|
| S2/tn93:kappaPur |
1.815 |
(1.069, 2.76) |
1.041 |
908761 |
152
|
1 | 1
|
| I1/rs07:mean_length |
1.268 |
(1.118, 1.458) |
1.733 |
545898 |
206
|
1 | 0.9998
|
| I1/rs07:log_rate |
-2.196 |
(-2.529, -1.868) |
2.156 |
438830 |
167
|
0.9998 | 0.999
|
| I2/rs07:mean_length |
1.096 |
(1.002, 1.275) |
4.007 |
236102 |
197
|
1 | 0.9978
|
| I2/rs07:log_rate |
-2.705 |
(-3.178, -2.258) |
3.753 |
252106 |
164
|
1 | 0.995
|
| |A1| |
242 |
(239, 246) |
107.3 |
8818 |
473 |
0.8 | 1.006
|
| #indels1 |
52 |
(47, 56) |
4.165 |
227153 |
169 |
0.8333 | 1.002
|
| |indels1| |
65 |
(59, 71) |
5.473 |
172856 |
352 |
0.8889 | 1.002
|
| #substs1 |
210 |
(204, 215) |
44.49 |
21265 |
248 |
0.8571 | 1.001
|
| #substs2 |
12 |
(12, 12) |
1.134 |
834478 |
6 |
1 | 0.9998
|
| |A3| |
171 |
(169, 173) |
82.85 |
11419 |
382 |
0.64 | 0.9979
|
| #indels3 |
25 |
(22, 28) |
24.22 |
39066 |
116 |
0.75 | 0.9996
|
| |indels3| |
26 |
(23, 30) |
15.81 |
59846 |
126 |
0.75 | 1.001
|
| #substs3 |
154 |
(149, 159) |
8.522 |
111021 |
182 |
0.8571 | 0.9986
|
| Scale1*|T| |
1.102 |
(0.9472, 1.269) |
1.924 |
491680 |
118
|
0.9999 | 0.9986
|
| Scale2*|T| |
0.07795 |
(0.03826, 0.125) |
1.026 |
922056 |
159
|
1 | 0.9963
|
| |A| |
430 |
(425, 434) |
143.6 |
6590 |
546 |
0.7442 | 1.003
|
| #indels |
79 |
(73, 84) |
12.89 |
73426 |
263 |
0.875 | 1.002
|
| |indels| |
94 |
(87, 101) |
12.28 |
77070 |
371 |
0.9114 | 1.002
|
| #substs |
377 |
(369, 384) |
25.99 |
36399 |
371 |
0.9 | 1
|
| |T| |
0.9841 |
(0.7546, 1.229) |
1 |
946098 |
176
|
0.9999 | 0.9985
|
Phylogeny Distribution


Alignment Distribution
Partition 1
|
|
|
Diff |
|
Min. %identity |
# Sites |
Constant |
Informative |
| Initial |
FASTA |
HTML |
Diff |
|
68.9% |
223 |
93 (41.7%) |
93 (41.7%) |
| Best (WPD) |
FASTA |
HTML |
|
AU |
69.4% |
243 |
92 (37.9%) |
99 (40.7%) |
Partition 2
|
|
|
Diff |
|
Min. %identity |
# Sites |
Constant |
Informative |
| Initial |
FASTA |
HTML |
|
|
68.8% |
16 |
4 (25%) |
5 (31.2%) |
Partition 3
|
|
|
Diff |
|
Min. %identity |
# Sites |
Constant |
Informative |
| Initial |
FASTA |
HTML |
Diff |
|
74.4% |
172 |
77 (44.8%) |
75 (43.6%) |
| Best (WPD) |
FASTA |
HTML |
|
AU |
78.6% |
171 |
80 (46.8%) |
62 (36.3%) |
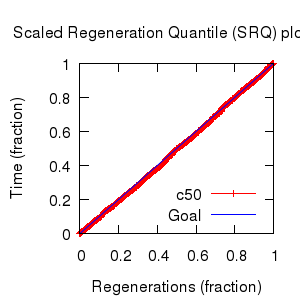
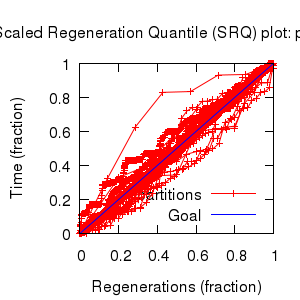
Mixing
Statistics: | scalar burnin | 546 | | scalar ESS | 6591 | | topological ESS | 1400.757 | | ASDSF | 0.002 | | MSDSF | 0.016
| | PSRF CI80% | 1.001 | | PSRF RCF | 1.006 |
|
|
Analysis
command line: bali-phy -c ITS.txt --name ITS-3.1.5
directory: /gpfs/fs0/data/wraycompute/br51/Work/3.1
version: 3.1.5
| chain # | burnin | subsample | Iterations (after burnin) | subdirectory |
|---|
| 1 |
10957 |
1 |
146913 |
ITS-3.1.5-1 |
| 2 |
10957 |
1 |
111407 |
ITS-3.1.5-2 |
| 3 |
10957 |
1 |
119290 |
ITS-3.1.5-3 |
| 4 |
10957 |
1 |
116229 |
ITS-3.1.5-4 |
| 5 |
10957 |
1 |
120336 |
ITS-3.1.5-5 |
| 6 |
10957 |
1 |
118486 |
ITS-3.1.5-6 |
| 7 |
10957 |
1 |
114788 |
ITS-3.1.5-7 |
| 8 |
10957 |
1 |
98615 |
ITS-3.1.5-8 |
| P(data|M) = -2999.712 +- 0.366
|
Complete sample: 1034060
topologies |
95% Bayesian credible interval: 982357 topologies |
Model and priors
Tree (+priors)
| topology | ~ uniform on tree topologies |
| branch lengths | ~ iid[num_branches[T],gamma[0.5,div[2,num_branches[T]],0.0]] |
Substitution model (+priors)
| S1 | = |
tn93+Rates.free[,,3]
| tn93:kappaPur | ~ | log_normal[log[2],0.25]
|
| tn93:kappaPyr | ~ | log_normal[log[2],0.25]
|
| tn93:pi | ~ | dirichlet_on[letters[a],1]
|
| Rates.free:rates | ~ | dirichlet[n,2]
|
| Rates.free:frequencies | ~ | dirichlet[n,3]
|
|
| S2 | = |
tn93
| tn93:kappaPur | ~ | log_normal[log[2],0.25]
|
| tn93:kappaPyr | ~ | log_normal[log[2],0.25]
|
| tn93:pi | ~ | dirichlet_on[letters[a],1]
|
|
Indel model (+priors)
| I1 | = |
rs07
| rs07:log_rate | ~ | laplace[-4,0.707]
|
| rs07:mean_length | ~ | exponential[10,1]
|
|
| I2 | = |
rs07
| rs07:log_rate | ~ | laplace[-4,0.707]
|
| rs07:mean_length | ~ | exponential[10,1]
|
|
Scales (+priors)
| scale1 | ~ |
gamma[0.5,2,0.0]
|
| scale2 | ~ |
gamma[0.5,2,0.0]
|
 3D
3D
